

Organizations have more data, reports, dashboard and predictive models than ever. Yet a familiar problem remains: teams can see the same signal and still make decisions separately, causing the organization to react too late.
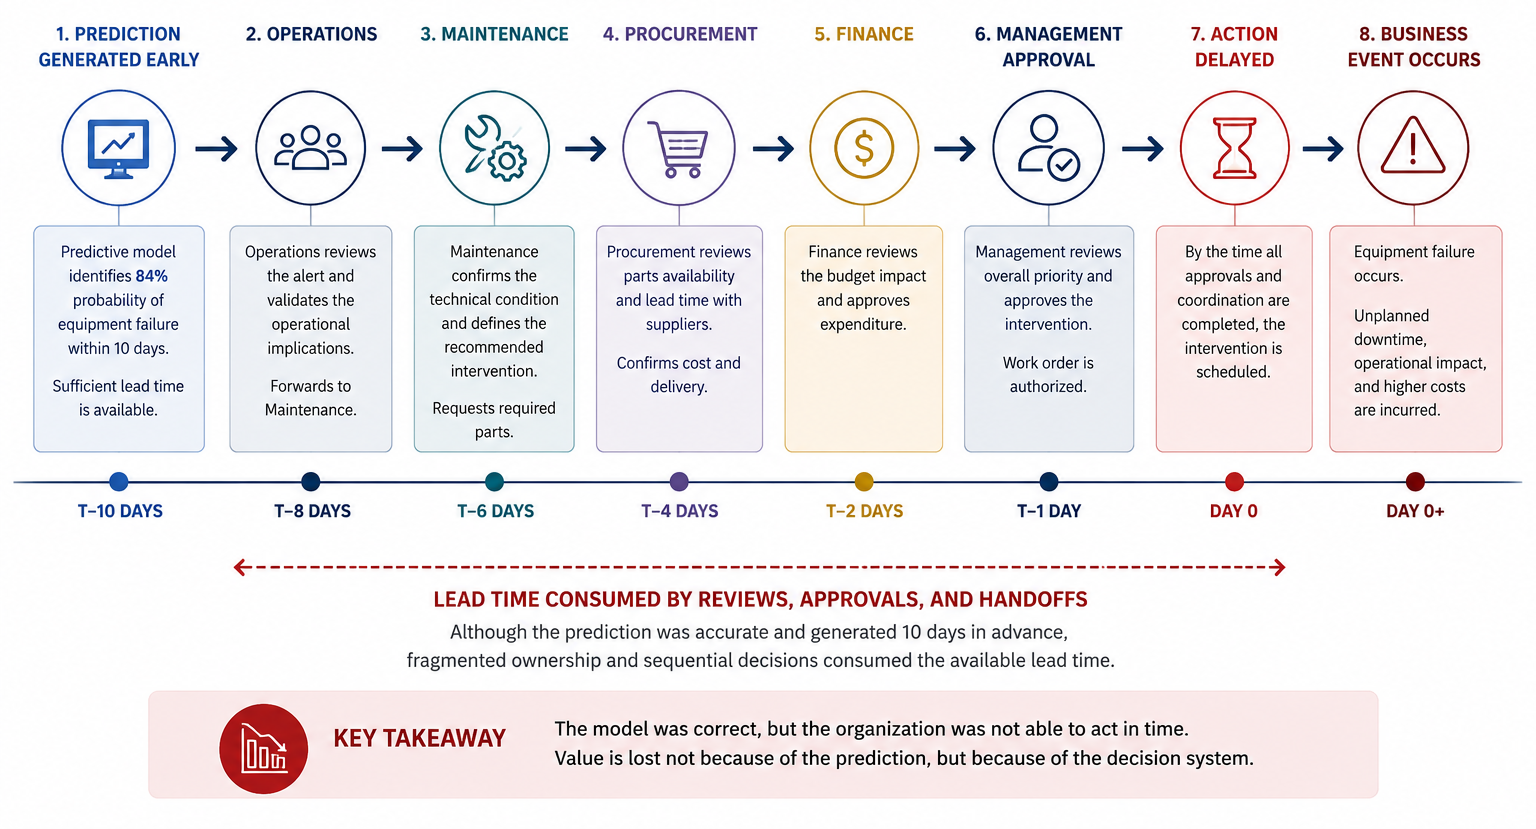
Consider an illustrative predictive-maintenance scenario. A model identifies an 84% probability of equipment failure within the next 10 days. From a modelling perspective, the system has done what predictive analytics is supposed to do: detect a future risk early enough to create decision time.
But detecting the risk is only the beginning. Operations reviews the alert. Maintenance validates the technical condition. Procurement checks parts availability. Finance evaluates the expenditure. Management or Operations authorizes the intervention. If these activities happen as disconnected decisions rather than as one coordinated response, much of the available lead time can disappear before action begins.
The model was not necessarily wrong. The decision system around the model was too fragmented to act in time.
This distinction matters as organizations expand their use of predictive analytics, predictive data analytics, machine learning algorithms and AI decision-making. Predictive accuracy alone does not create business value. The organization must also translate predictive signals into shared thresholds, clear ownership, coordinated workflows and timely action.
Predictive analytics should therefore be treated as part of a broader data-driven decision-making capability, not simply as a forecasting tool.
Summary of Key Concepts
What Predictive Analytics Actually Is - Technically
Predictive analytics uses historical and current data, statistical modelling and machine learning to estimate future outcomes or probabilities. Google Cloud describes it as an advanced branch of data science that uses historical data, statistical modelling and machine learning to answer what might happen next, while ScienceDirect similarly frames predictive analytics around data mining, predictive statistics and machine learning to forecast future events or outcomes.
A useful way to distinguish analytical capabilities is by the question each one supports:
· Descriptive analytics: What happened?
· Diagnostic analytics: Why did it happen?
· Predictive and prescriptive analytics: What is likely to happen and what action should follow?
In this article, predictive and prescriptive analytics are treated as a connected decision-support capability. Predictive models identify likely outcomes, values, risks, or probabilities; prescriptive logic translates those signals into recommended responses, thresholds, or business rules. The model output may be a forecast, estimated value, class label, probability, or risk score, but it is not a complete business decision by itself.
Modern predictive analytics can combine supervised and unsupervised machine-learning techniques. Supervised methods such as regression and classification learn from labelled data, while unsupervised methods such as clustering and anomaly detection identify patterns or unusual observations in unlabelled data that can support predictive decisions. Google Cloud identifies regression, decision trees and neural networks among common predictive methods, while IBM describes regression and classification as foundational supervised-learning approaches for modelling relationships between input features and target outcomes.
Two Common Predictive Modelling Approaches: Regression and Classification
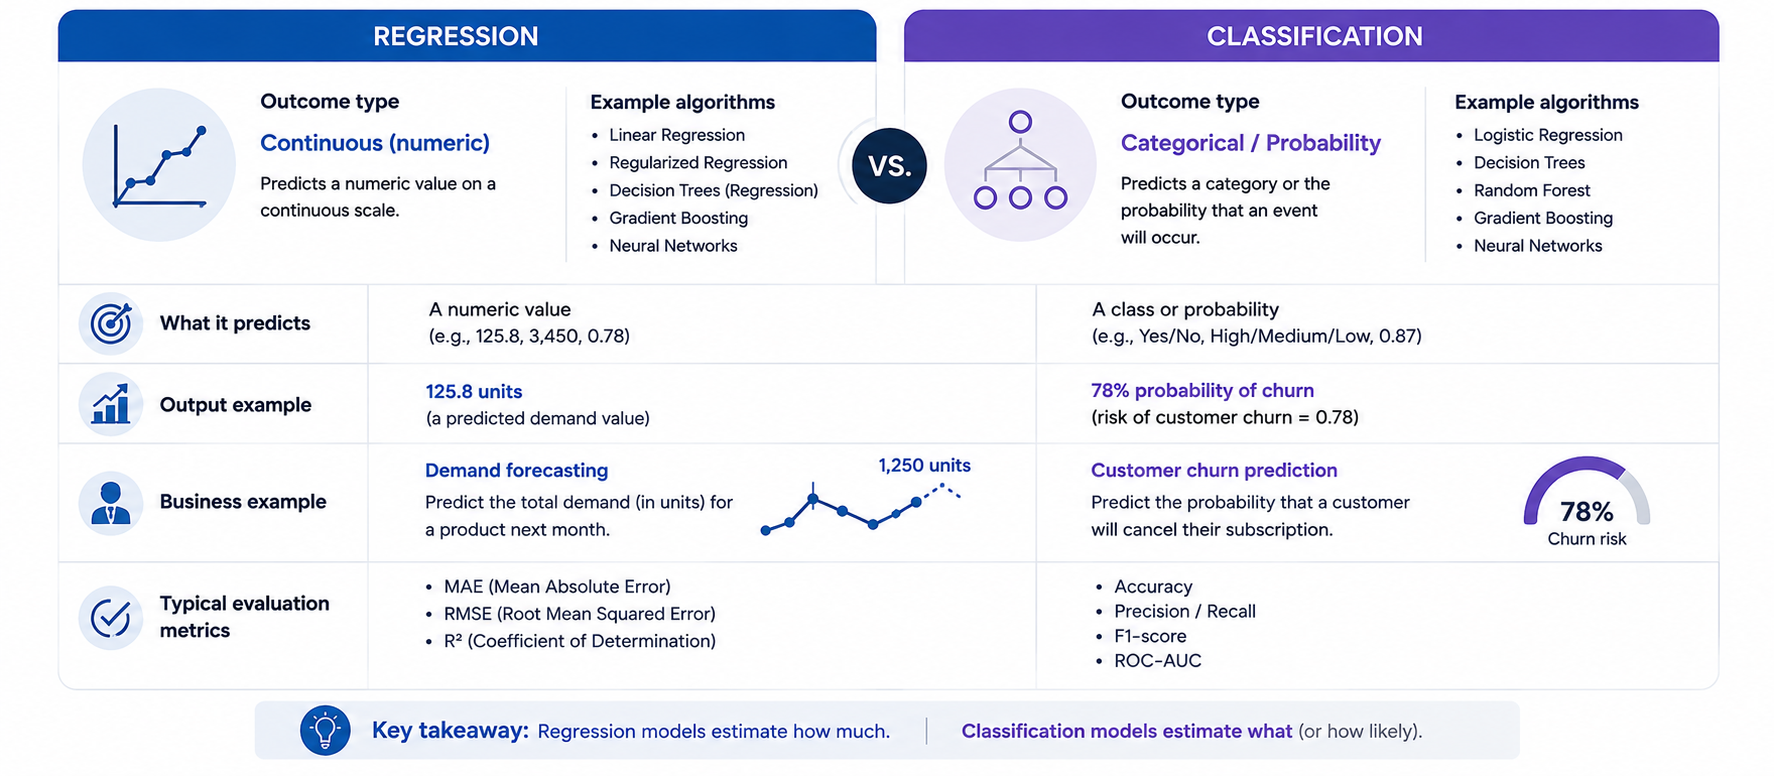
Predictive modelling can use many techniques depending on the business problem, data available and type of outcome required. Regression and classification are two common supervised approaches that illustrate one of the key model-selection decisions: whether the target is a continuous numerical value or a discrete class/probability.
Regression and classification are both supervised machine-learning approaches, but they solve different target problems. Regression predicts a continuous numerical value, while classification predicts a discrete category; classification systems can also produce class probabilities or risk scores depending on the model and implementation.
A regression model might estimate next month’s demand, expected revenue, delivery time, maintenance cost, or remaining equipment life. Common approaches include linear and multiple regression, regularized regression, regression trees, gradient boosting and neural networks. Regression performance is commonly assessed with measures such as Mean Absolute Error (MAE), Mean Squared Error (MSE), Root Mean Squared Error (RMSE) and R².
A classification model answers a different question: which class is most likely, or how likely is a particular event? Examples include customer churn, fraud, equipment failure, loan default, or lead conversion. Common methods include logistic regression, decision trees, random forests, gradient boosting and neural networks. Classification performance may be evaluated using accuracy, precision, recall, F1 score, ROC-AUC and a confusion matrix.
Why the type of model error matters
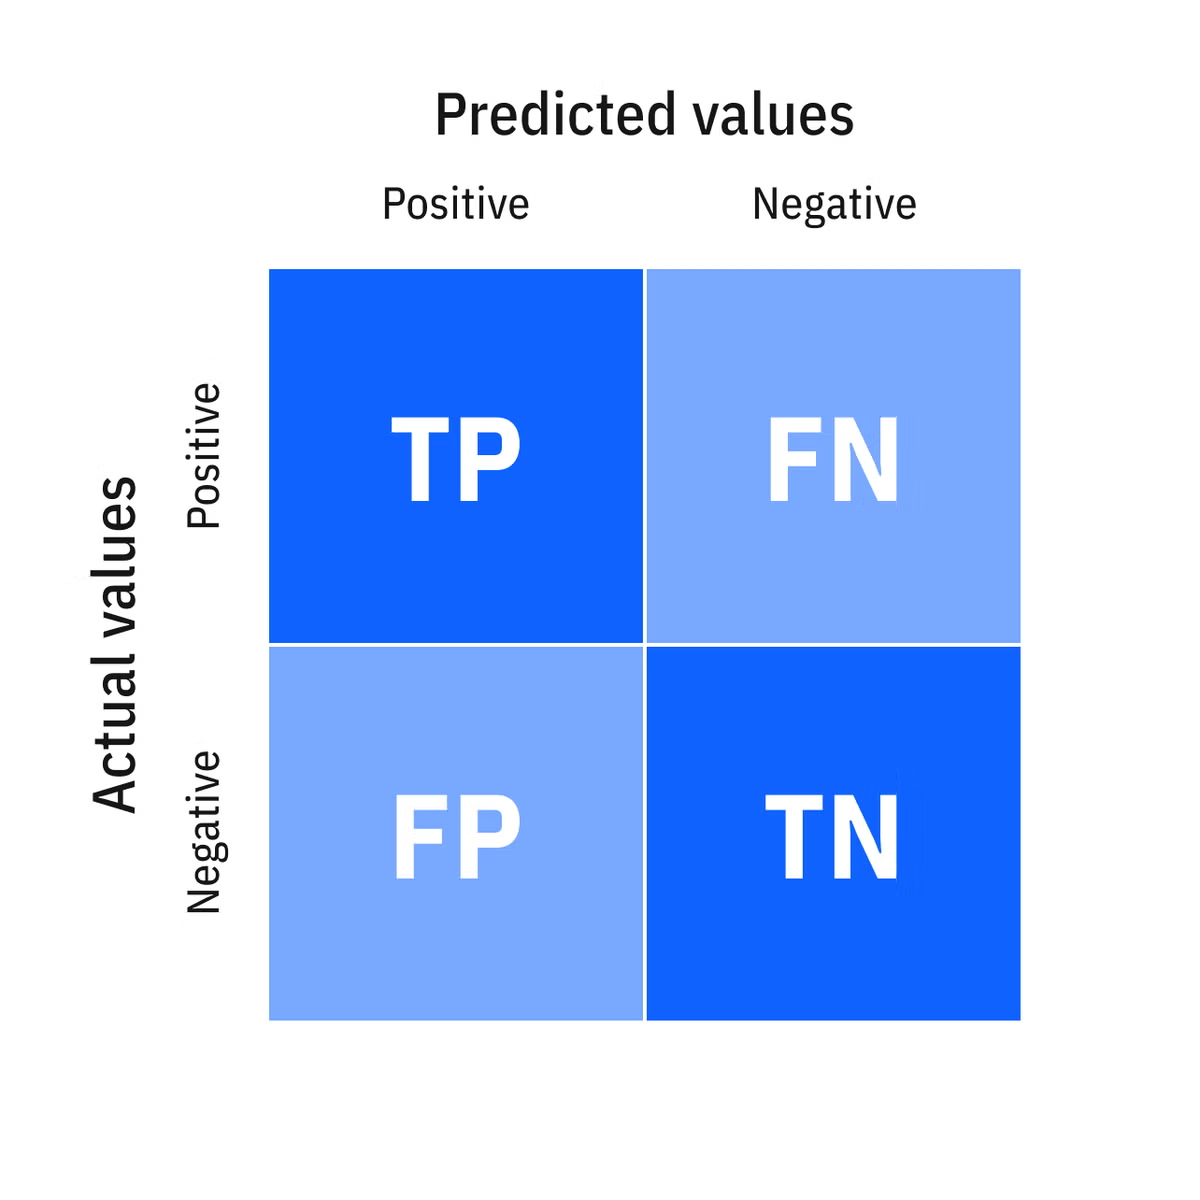
Classification models are commonly evaluated by comparing predicted outcomes with actual outcomes. A confusion matrix organizes those results into true positives (TP), true negatives (TN), false positives (FP) and false negatives (FN). This adds information that overall accuracy alone cannot provide because it shows not only whether the model was correct, but also how it was wrong.
· True Positive (TP): The model predicts that an event will occur and it does.
· True Negative (TN): The model predicts that an event will not occur and it does not.
· False Positive (FP): The model predicts that an event will occur, but it does not.
· False Negative (FN): The model predicts that an event will not occur, but it actually does.
The distinction matters because different prediction errors can carry very different business consequences. In predictive maintenance, a false positive may trigger an unnecessary inspection or maintenance action, while a false negative may leave a genuinely high-risk asset without intervention. The appropriate decision threshold therefore depends not only on statistical performance but also on the operational and financial cost of each type of error.
How Predictive Data Modelling Works Today
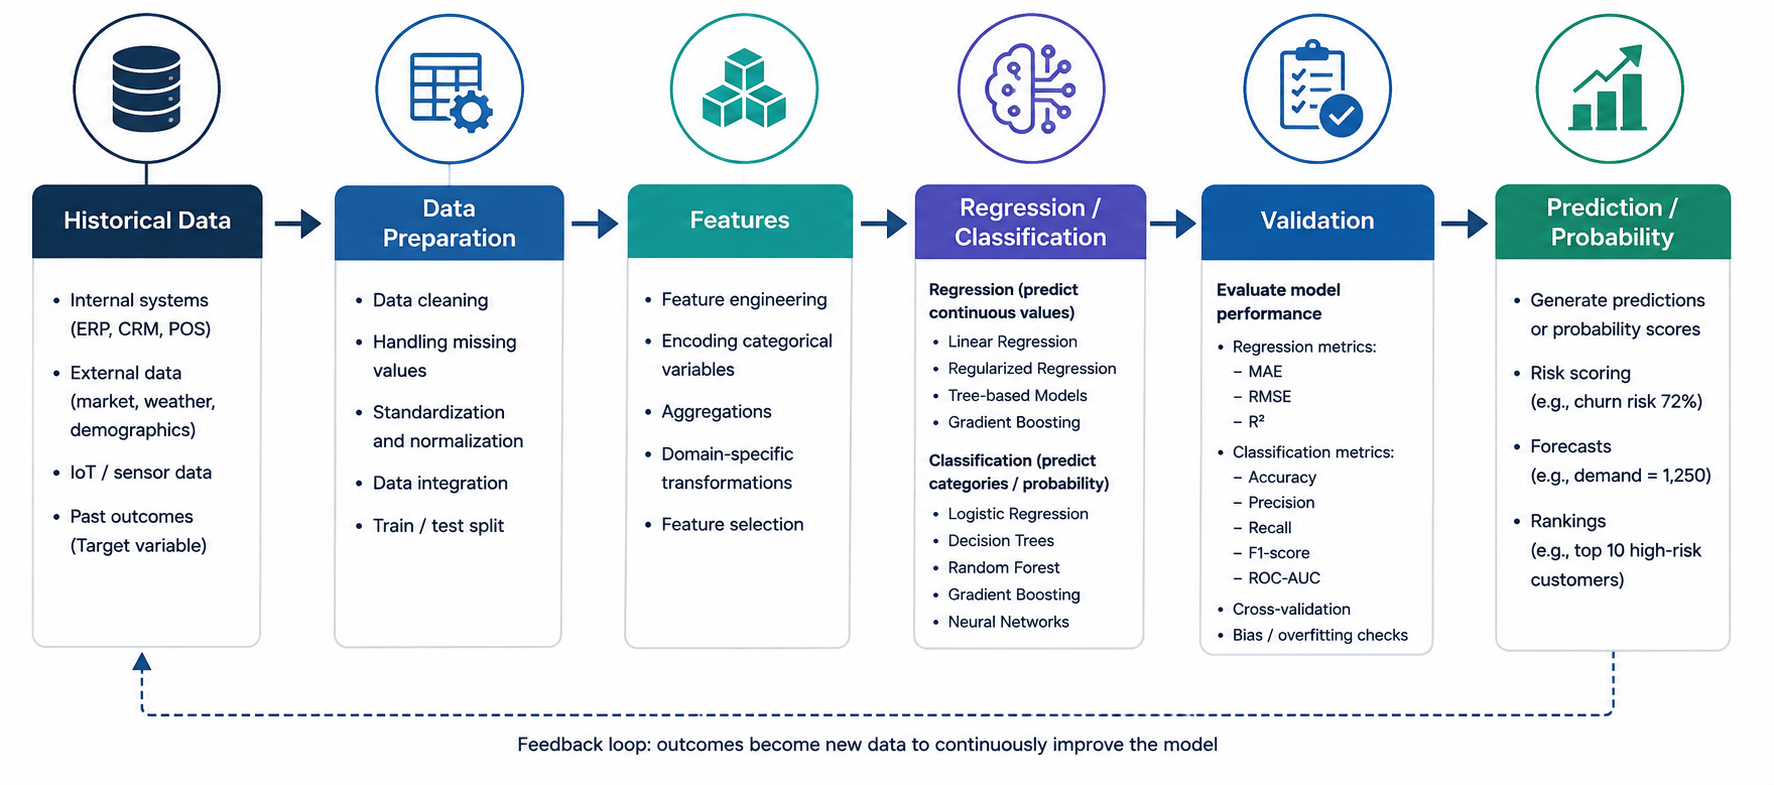
Modern predictive modelling is best understood as a lifecycle rather than a single algorithm. The process typically includes defining the use case, preparing data and features, training and evaluating models, deploying them and continuously monitoring performance as data and business conditions change. AWS describes these stages as part of the broader machine-learning lifecycle, including data preparation, feature engineering, model development, deployment and monitoring.
1. Define the target and the decision problem
The modelling process begins with a specific target: revenue next month, churn probability, equipment-failure risk, expected cycle time, fraud risk, or another measurable outcome. The target should be framed around a question that can later be connected to an operational decision. A technically measurable target that has no clear decision use case may produce an interesting model but limited business value.
2. Acquire, integrate, and prepare the data
Relevant historical and current data may come from ERP and CRM platforms, financial systems, operational applications, sensors, customer interactions, external data, or other sources. These datasets usually require cleaning, integration, standardization and quality checks before they are suitable for modelling. Missing values, measurement errors, duplicate records, inconsistent identifiers and anomalous observations can bias the model or reduce its reliability.
This is why data quality is part of the predictive capability itself. Data analytics and machine learning depend on a stable foundation: the model can only learn from the information it receives.
3. Engineer useful features
Feature engineering transforms raw data into predictors that better represent behavior or operating conditions. Customer transactions, for example, may become purchase frequency, average order value, days since last purchase, tenure, or support-contact frequency. Equipment sensor readings may become temperature trends, vibration changes, utilization rates, or rates of change over time.
Feature quality often determines whether a model captures a useful signal or simply fits noise. The purpose is not to create more variables, but to represent the mechanisms that may help explain or predict the target outcome.
4. Train the model
In supervised learning, labelled historical examples are used to estimate the relationship between features (X) and a known target (Y). In unsupervised learning, models are trained on unlabelled data to identify patterns, clusters, or anomalies without a predefined target variable. These models still require validation and testing, although evaluation methods differ because there is no known target outcome to compare predictions against. The modelling method should be selected according to the decision problem, data structure, interpretability requirements and expected operating environment.
5. Validate performance
Validation tests whether the model generalizes beyond the data used to train it. Regression and classification therefore require different performance measures. The chosen metric should reflect the business problem: minimizing average forecast error is different from identifying nearly every high-risk event and both are different from minimizing costly false alarms.
6. Score new observations and monitor the model
Once validated, the model can score new observations and generate forecasts, classes, or probabilities. Monitoring should then track both statistical performance and operational relevance. Data distributions change, customer behavior changes, equipment ages, processes are redesigned and decision policies evolve. A model that performed well at deployment can become less useful if those changes are not detected and incorporated into the feedback loop.
Why Model Performance Is Not Enough: Five Ways Decision Siloes Undermine Predictive Analytics
A predictive model can perform well statistically and still fail to improve business outcomes. Model performance measures how reliably the model estimates an outcome; decision performance depends on whether the organization can interpret the signal, coordinate the appropriate response, and act consistently and in time. Cross-silo collaboration is difficult precisely because work, information, incentives and relationships often remain organized around functional boundaries. Harvard Business Review has repeatedly highlighted the challenge of data and organizational silos in limiting access and cross-functional collaboration.
1. Teams interpret the same prediction differently
The same predictive signal can mean different things to different functions. A 75% customer churn probability, for example, may prompt Marketing to launch a retention campaign, Sales to contact the account, Customer Success to escalate the relationship and Finance to revise a revenue expectation.
Without shared definitions, priorities and decision rules, the same model output can generate competing actions instead of a coordinated response. Predictive insights therefore need a common decision framework that defines how functions should interpret and respond to the same signal.
2. Predictions are not connected to business thresholds
A model can produce probabilities continuously, but a probability does not automatically determine when the business should act. Organizations need thresholds that translate predictive outputs into specific responses such as monitoring, review, intervention or escalation.
An illustrative framework might define less than 40% as monitor, 40–70% as review, above 70% as intervene and above 90% as immediate escalation. The exact thresholds should not be arbitrary. They should reflect the business cost of false positives and false negatives, available resources, service levels, regulatory constraints and the consequences of delayed action.
This is where predictive and prescriptive analytics become operationally connected: the model estimates the likelihood of an outcome, while business rules determine what response should follow.
3. Decision ownership is unclear
Predictive and prescriptive analytics can indicate what is likely to happen and what response may be appropriate, but governance must still define who has the authority and accountability to decide and act. Ownership is often distributed across multiple functions, creating dependencies between analysis and execution.
Return to the equipment-failure scenario. The model identifies an 84% probability of failure within the next 10 days. The prediction may provide sufficient lead time, but Maintenance validates the technical condition, Procurement controls parts availability, Finance approves expenditure and Operations authorizes the intervention. The problem is not that the model predicted the failure too late. The organization can consume the available lead time through fragmented ownership, sequential decisions and cross-functional coordination.
A model can consequently be technically correct while the organization still experiences the failure or cost the model was intended to prevent.
4. Predictions stop at the dashboard
A predictive insight has limited operational value if it remains inside a dashboard and depends on users to discover, interpret and manually communicate it. If employees must open a report, evaluate the score, contact another team, request approval and create a task before anything happens, part of the analytical lead time is lost to process friction.
Decision-ready analytics connects predictive scores to alerts, business rules, workflows, approvals and operational systems. The objective is not simply to make a prediction visible. It is to ensure that the appropriate process can begin when the relevant decision threshold is reached.
5. Teams optimize local KPIs instead of the enterprise outcome
Even when teams have access to the same prediction, they may respond according to different functional objectives. Sales may favor additional inventory to protect revenue. Finance may prioritize lower working capital. Operations may prefer schedule stability. Procurement may optimize purchase price or order volume.
Each individual decision can be rational from a functional perspective, while the combined outcome is suboptimal for the organization. Predictive analytics therefore requires shared decision objectives, not merely shared data or shared dashboards. The value of the model depends on whether teams use the prediction to optimize the enterprise outcome rather than their individual KPIs.
Bridging the Gap
From Predictive Models to Decision Intelligence
The maturity shift is not simply from basic models to more advanced machine learning. It is from generating predictions to embedding those predictions inside repeatable decision and execution processes.
In this article, decision intelligence refers to the combination of technical, decision and operational capabilities required to move from a predictive signal to a measurable outcome:
· Technical capabilities: data integration, feature engineering, statistical modelling, machine learning, validation, scoring and model monitoring.
· Decision capabilities: thresholds, business rules, decision ownership, cross-functional governance and escalation logic.
· Operational capabilities: workflow integration, automation, system integration, auditability and outcome measurement.
A strong predictive capability therefore does more than answer “What is likely to happen?” It connects that answer to “What should we do?”, “Who decides?”, “What process starts?”, and “How will we know whether the decision worked?”
From Prediction to Coordinated Action: A Cross-Functional Decision Framework
Predictive analytics creates business value when model outputs are connected to the decision and operational processes required to act on them. This means combining predictive signals with thresholds, clear ownership, cross-functional coordination, defined actions and outcome measurement. In this article, this broader capability is referred to as decision intelligence.
For every predictive use case, teams need a clear understanding of what the model is estimating and how its output should be interpreted. This clarity extends to knowing when action is required and who owns the decision. Just as importantly, teams should identify which stakeholders are involved, determine the appropriate response, and establish how the outcome will be measured.
The following table summarizes the key decision elements that should be defined around each predictive use case. It shows how The Daita Solution’s Predictive Analytics & Decision Support service helps clients move from model output to coordinated business action.
The Daita Solution's Predictive Analytics & Decision Support service helps organizations turn predictive outputs into repeatable business decisions. Rather than treating each prediction as an isolated modelling exercise, we work with clients to build the decision-making structure summarized in the table below, so that every output is grounded in clear ownership, thresholds and measurable outcomes. This turns predictive analytics into a genuine decision-support capability designed to maximize business value.
The result is not simply a more accurate prediction. It is a decision-ready system designed to move from signal to coordinated action.
Prediction and Action Need to Become One System
Organizations do not solve the decision problem simply by building better models. Sophisticated regression models, classifiers, real-time scoring and accurate forecasts can still create limited value if departments interpret and act on predictions independently.
The stronger operating model connects models with business rules, ownership, workflows, and feedback. It gives teams a shared understanding of what the signal means, when action is required, who is responsible, how execution should occur and how the result will be measured.
That is the broader purpose of predictive analytics. It should not stop at forecasting what happens next. It should help the organization decide what to do next, early enough to change the outcome.

Chuka Christopher Ilochi
Turn Predictions Into Coordinated Action
Connect predictive insights to clear thresholds, ownership, and timely business decisions with The Daita Solution.

About The dAIta Solution
The dAIta Solution provides strategic consultancy, process and data mining, analytics, reporting and automation implementation solutions powered by AI that enable organizations to achieve their full potential hidden within the information that they possess. Our proprietary mining and analytics techniques and vendor-agnostic AI and data software streamlines the path to results and facilitates automation of both the analysis of your organization and implementing solutions to weaknesses or growth opportunities identified. Founded by senior consultancy services executives, data scientists and former EY leaders, The dAIta Solution is headquartered in Los Angeles with operations in London, Lagos and Singapore. For more information, please visit thedaitasolution.com.
Latest Resources



Want to see The dAIta Solution in action?
Get in touch now for a free demo of the platform, our products and services