


Business intelligence dashboards are everywhere. A modern data dashboard can centralize KPIs, automate recurring views, and make performance easier to explore. Organizations have invested heavily in BI platforms, automated reports, self-service analytics, and increasingly sophisticated visualization. Yet more visibility does not automatically produce better decisions. A report can be accurate, timely, and visually polished while still leaving decision-makers unsure about what matters, what changed, or what they should do next.
Wells Fargo Board Investigation, 2017, offers a useful real-world lesson. The issue was not a lack of performance metrics. The bank operated a highly performance-driven sales culture built around aggressive goals and cross-selling. In 2017, the board’s independent investigation found that the Community Bank’s sales culture and performance-management system had become distorted, creating pressure that contributed to unwanted or unauthorized products. The investigation also concluded that senior leadership was too slow to critically challenge the model as problems became more visible.
Regulators had already found that employees opened more than two million deposit and credit-card accounts that may not have been authorized, driven in part by sales targets and compensation incentives. CFPB enforcement action lesson to be learned from this case is that an indicator can be visible, subject to frequent monitoring, and even appear to support a narrative of corporate success, without necessarily contributing to the right decision.
That is the gap many organizations still face today. They have business intelligence and reporting infrastructure, but decision-makers still spend time interpreting what numbers mean, debating which figures are correct, trying to determine whether performance is actually good or bad, receiving information after the useful decision window has passed, or seeing a problem without knowing who owns the response.
What Decision-Support Reporting Actually Looks Like
Traditional reporting often stops at description: revenue increased, churn rose, ticket volume fell, or a project missed its target. Decision-support reporting goes further. It progressively helps the reader answer five questions:
1. What happened?
2. Is that performance good or bad?
3. How significant is the difference?
4. Why did it happen?
5. What requires attention or action?
That progression is what turns BI reporting into a management capability. Zebra BI frames actionable reporting around a similar sequence, which is to evaluate whether performance is good or bad, understand the magnitude, explain why, and determine what to do about it. ThoughtSpot likewise recommends starting executive dashboard design with the decisions and questions the dashboard must support rather than with the available metrics or visualizations.
Sign #1 - Your Reports Track Metrics, but Not the Decisions They Support
The first warning sign is metric abundance without decision relevance. Modern analytics tools make it easy to track hundreds of measures because the data is available. But availability is not the same as usefulness. The better question is: What decision becomes easier because this KPI exists? If there is no clear answer, the metric may have limited decision value.
An available metric says, “We can measure it.” A decision-relevant KPI says, “This tells us whether something needs attention, whether an intervention is working, or whether we need to change course.” This distinction is central to data-driven decision making because it connects reporting to an actual management choice rather than to the mere availability of data.
From an activity metric to a decision-relevant KPI
Consider website traffic. Knowing that a website received 100,000 visits in a month describes activity, but it does not tell the marketing team whether that activity contributed to a business objective. Qualified-lead conversion compared with a defined target is more decision-relevant. If conversion falls below expectations, the organization has a clearer signal to investigate campaign targeting, landing-page performance, lead quality, or another part of the acquisition process.
The same logic applies to customer service. Total ticket volume can indicate workload, but it says little about service performance by itself. SLA breaches segmented by root cause and severity help managers distinguish routine volume from issues that threaten customer experience, contractual commitments, or operational performance.
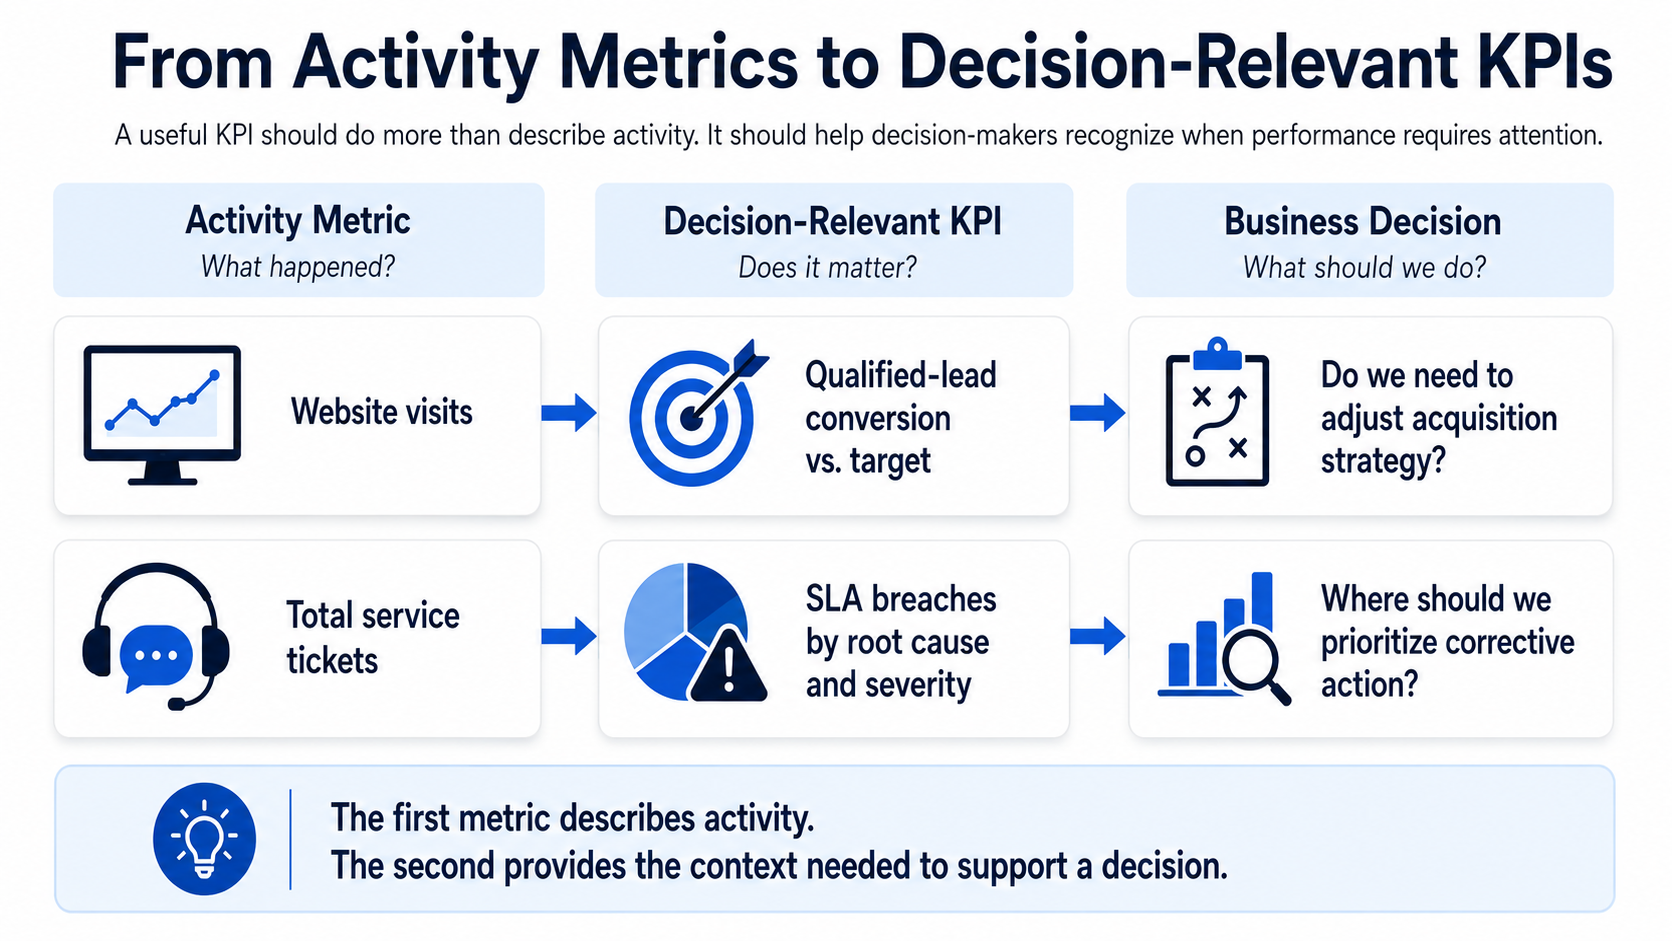
The goal is not fewer metrics for the sake of simplicity. It is a stronger alignment between business objectives, management decisions, and the KPIs used to support them. This is why executive dashboards should begin with the audience and the decisions they make, not with a list of every measure the organization can technically display. (ThoughtSpot: Executive Dashboards)
Sign #2 - Your Numbers Have No Benchmark or Performance Context
A number without context is often just a number. Imagine an executive opens a business intelligence dashboard and sees “Customer retention: 87%.” Is that strong performance? Has retention improved? Is it below the annual target? Is it better than the forecast? Is it competitive relative to an internal peer group or an external benchmark? Without a reference point, the reader has to supply the meaning.
Decision-ready reporting typically combines the current value with one or more comparison lenses:
- Target - Where should we be?
- Historical performance - Are we improving or deteriorating?
- Forecast - Where are we heading if the current trajectory continues?
- Internal or external benchmark - How does our performance compare?
FM Magazine, 2018, has long highlighted the same issue in financial reporting: comparative figures such as prior-period values or budget amounts make it easier for readers to determine whether results exceed or fall short of expectations.
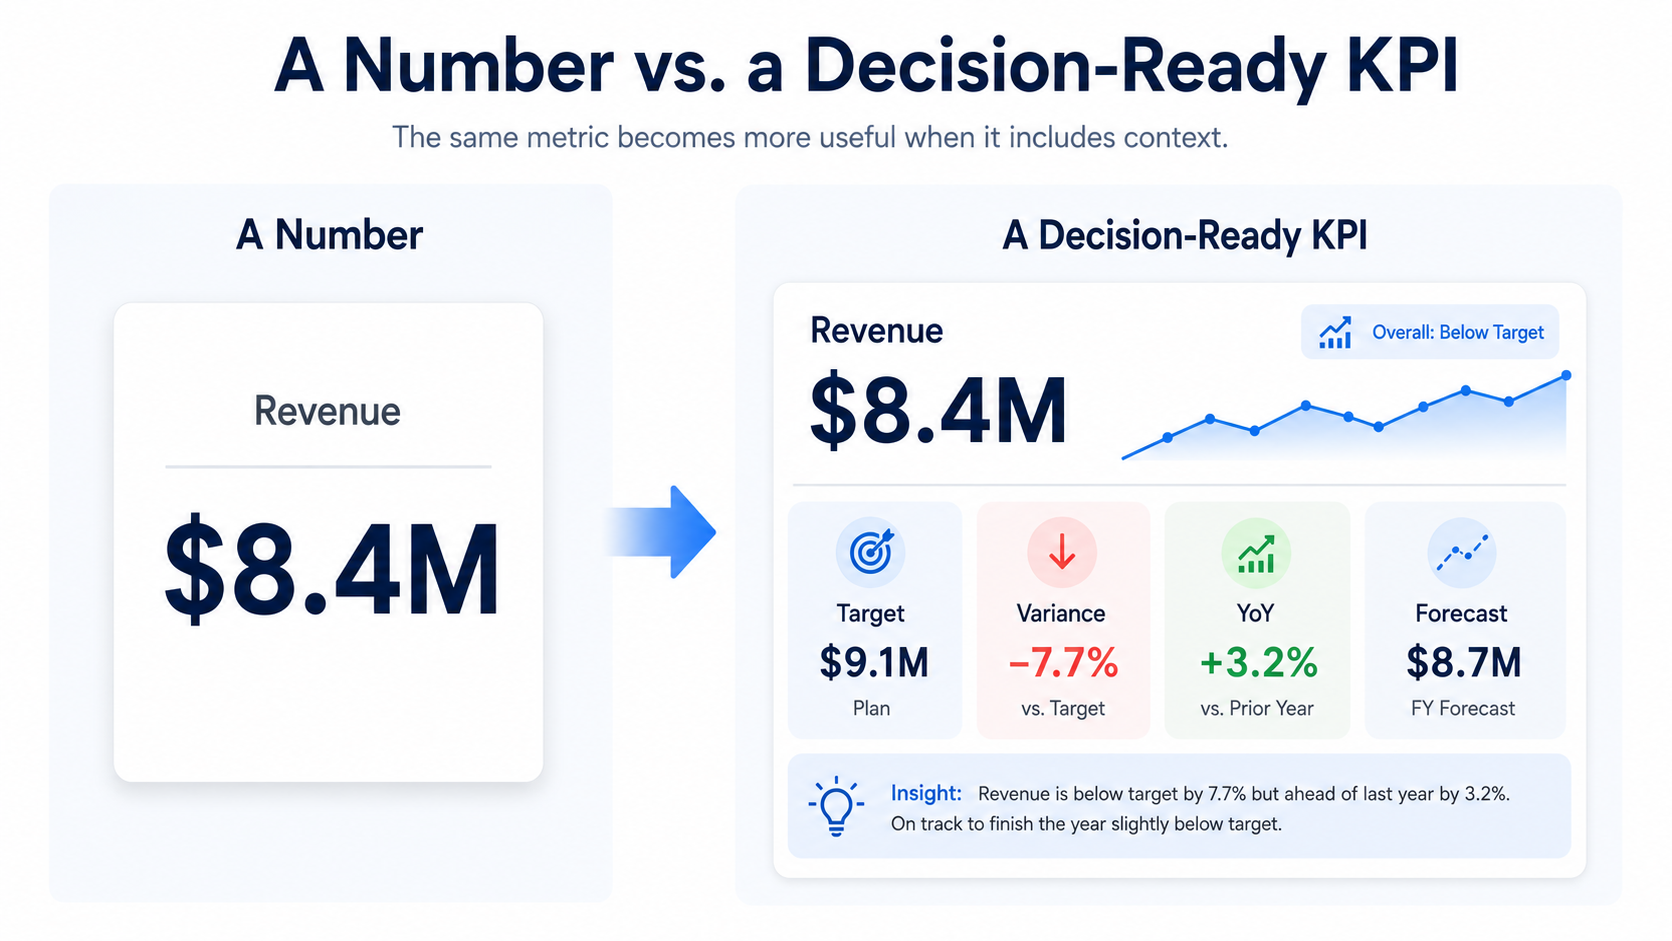
Consider revenue. “Revenue: $8.4M” is factual, but it does not tell a decision-maker what the number means. Add a $9.1M target, a -7.7% variance, +3.2% year-over-year growth, and an $8.7M forecast, and the same metric becomes more useful. The discussion can now shift from “What is the number?” to “Why are we below target despite year-over-year growth, and what needs to change before year-end?”
Sign #3 - People Spend More Time Explaining the Report Than Discussing What to Do
A management meeting should not become a guided tour of the dashboard. If the first half of the meeting is spent navigating tabs, reconciling definitions, explaining chart logic, or finding the relevant breakdown, the reporting environment itself is adding friction to the decision process.
Common questions are familiar: “What does this metric mean?” “Which period are we comparing?” “Why is this different from Finance’s number?” “Where is the regional breakdown?” or “Which of these charts should I be looking at?” These questions are not always a user-training problem. They can signal a deeper reporting-design problem.
Several factors cause this friction, such as an excess of metrics, an unclear visual hierarchy, inconsistent definitions, unnecessary details, and “one-size-fits-all” reports. Executive reports, operational reports, and analytical exploration serve different purposes. An executive needs a concise overview of strategic performance and emerging risks; an operations manager may need near-real-time information on exceptions and detailed insights; an analyst may need a flexible environment to investigate root causes. Forcing these three audiences to conform to the same reporting structure often compromises clarity for everyone.
FM Magazine 2024 warns that management reporting can fail when information is not timely, useful, or presented at the appropriate level for the decision-maker.
ReportDash and Luzmo similarly emphasize the risks of metric overload, weak context, and building reports around the data source rather than the reader’s needs.
Sign #4 - Everyone Sees the Problem, but Nobody Owns the Next Action
A dashboard may clearly show that customer churn increased by 18%. Everyone in the room can see the problem. But the report still fails as a decision-support tool if nobody knows who investigates the cause, who determines whether intervention is necessary, when the issue should be escalated, or what happens if the metric continues to deteriorate.
This is the difference between visibility and accountability. Mature reporting connects the KPI to an expected range, identifies the variance that matters, assigns an owner, supports a decision, and follows the resulting action through to an outcome. In other words, the reporting process should create a closed loop rather than end with a chart.
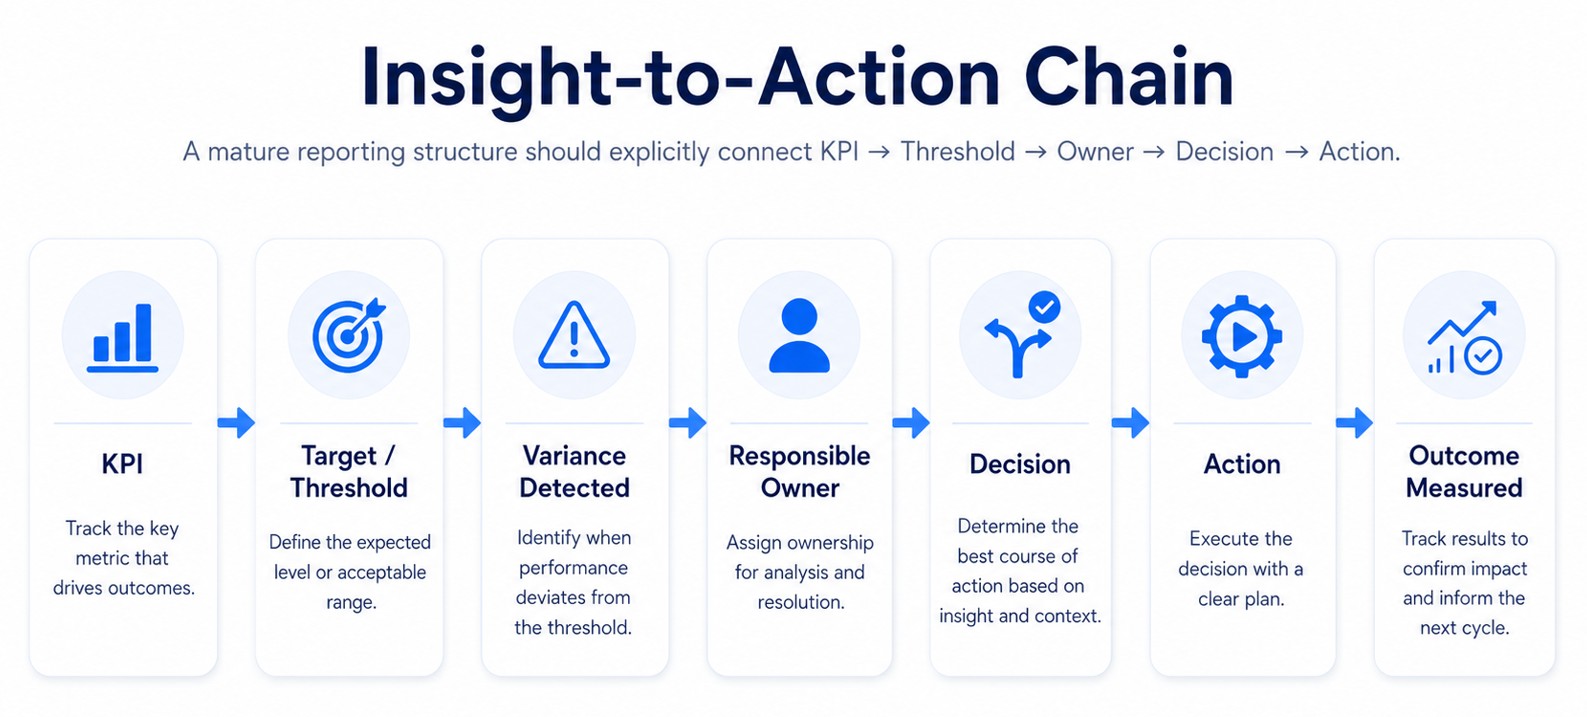
Ownership is especially important as organizations introduce performance analytics and decision intelligence. More sophisticated analysis can identify anomalies, drivers, or emerging risks, but the value of those insights still depends on who is responsible for interpreting them and acting. Barnett Brand Co. points out that reports are most useful for taking action when responsibility for key performance indicators (KPIs) is assigned to specific individuals and integrated into standard management routines.
Sign #5 - Your Reporting Cycle Is Slower Than Your Decision Cycle
Timeliness is not simply a technical refresh-rate question. It is a question of whether the reporting cadence matches the cadence of the decision. A monthly report can be appropriate for financial performance or strategic planning, but useless for an operational exception that needs intervention today.
A practical way to test reporting cadence is to start with the decision and work backward:
For critical KPIs, the reporting model can also evolve beyond “open the dashboard and search for a problem.” A threshold breach can trigger an alert, direct the issue to the responsible owner, initiate analysis, or create a workflow task. Automation does not replace management judgment; it reduces the lag between a meaningful signal and the next required step.
How to Turn Reporting into Decision Support
At The Daita Solution, we help organizations move beyond static dashboards by building reporting environments around the decisions the business needs to make.
This starts with establishing a reliable data foundation and identifying the KPIs that are truly connected to business objectives. From there, we help organizations add the context that makes those KPIs meaningful, such as targets, historical trends, forecasts, and relevant internal or external benchmarks.
But effective reporting does not stop at visibility. We also help structure reporting around clear ownership and decision-making processes, so that when performance deviates from expectations, teams can quickly understand what requires attention and who is responsible for taking action.
By combining data management, benchmarking and reporting, predictive analytics, and AI-powered automation, organizations can progressively move from simply monitoring performance to identifying issues earlier, prioritizing responses, and triggering the right actions more consistently.
From Dashboard to Decision Support: A Better Reporting Model
If the dashboard is not the end product, what should organizations build instead? A useful starting point is a five-layer reporting model that begins with the business decision and ends with action.
This sequence also helps organizations separate technology choices from reporting design. Power BI, Tableau, Looker, or another BI platform can make data accessible and interactive, but no business intelligence dashboard can compensate for unclear KPIs, missing benchmarks, conflicting definitions, weak ownership, or an undefined response process. The reporting model should come first; the screen should implement it.
The reporting maturity shift
As reporting improves, the management question changes. The organization moves from describing performance to creating a repeatable mechanism for intervention and learning.
This is also where business analytics can become more valuable. Descriptive BI reporting establishes visibility. Contextual reporting adds targets and benchmarks. Diagnostic analysis explains the drivers. Predictive analytics can surface emerging risks or likely outcomes. Automation can then reduce delay in routine responses. The objective is not maximum automation; it is a reporting and decision environment in which the level of analytical sophistication matches the business need.
Better Reporting Is Not About Building More Dashboards
Organizations rarely suffer from a shortage of metrics. The real challenge is turning those metrics into a reporting environment that helps decision-makers focus on what matters, understand performance in the right context, and quickly identify where attention is required.
Effective reporting should also make accountability clear. When performance moves away from expectations, teams should know who owns the response, what decision needs to be made, and what action should follow. Just as importantly, that information must arrive while there is still time to act.
Ultimately, better reporting is not about adding more dashboards or visualizing more data. It is about creating a clearer connection between KPIs, context, ownership, decisions, and action. When reporting is designed around that objective, it becomes more than a monitoring tool; it becomes a practical decision-support capability that helps organizations respond faster and with greater confidence.

Turn Reporting Into Better Decisions
Move beyond static dashboards. We help you build KPI, benchmarking, and reporting structures that give your teams the context, ownership, and insights needed to act with confidence.

About The dAIta Solution
The dAIta Solution provides strategic consultancy, process and data mining, analytics, reporting and automation implementation solutions powered by AI that enable organizations to achieve their full potential hidden within the information that they possess. Our proprietary mining and analytics techniques and vendor-agnostic AI and data software streamlines the path to results and facilitates automation of both the analysis of your organization and implementing solutions to weaknesses or growth opportunities identified. Founded by senior consultancy services executives, data scientists and former EY leaders, The dAIta Solution is headquartered in Los Angeles with operations in London, Lagos and Singapore. For more information, please visit thedaitasolution.com.
Latest Resources



Want to see The dAIta Solution in action?
Get in touch now for a free demo of the platform, our products and services